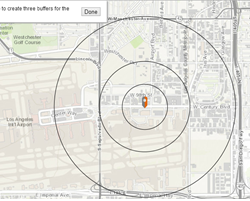
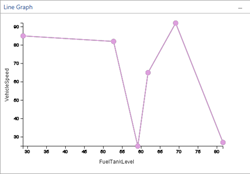
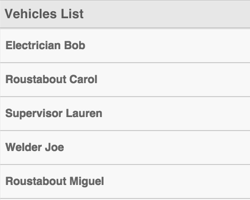
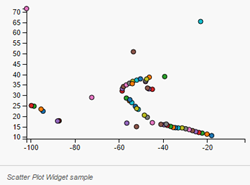
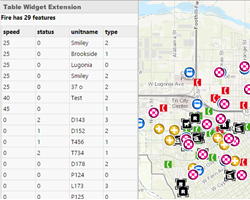
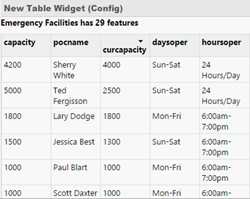
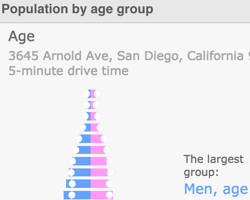
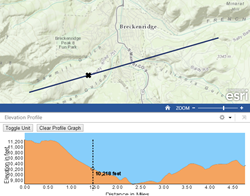
These samples demonstrate how to extend operation views for Operations Dashboard using the ArcGIS API for JavaScript. You can find the latest sample code here.
Buffer Map Tool: Generate a buffer from a selected location on the map.
View Source Code
Line Chart Widget: Create a line chart powered by data from your map or external data source.
View Source Code
List Widget: Use a data source, and display the data in a list.
View Source Code
Scatter Plot Widget: Use a specific data source to configure the widget, and display the data in the form of a scatter plot.
View Source Code
Table Widget: Display data in a tabular format.
View Source Code
Table with Configuration Widget: Use a specific data source to configure the widget, and display the data in a tabular format.
View Source Code
GeoEnrichment Widget: Use a GeoEnrichment service to show population
by age groups on the map. Use the widget to launch a custom map toolbar that can be used to interact with the map, and display the results.
View Source Code
Elevation Profile Widget: Create profile graphs by drawing lines interactively on the map.
View Source Code
Portal URL Widget: A widget that shows the currently signed in user and their role in the organization.
View Source Code
Export CSV Feature Action: Use a feature action that exports the results into a CSV table.
View Source Code
Browser Feature Action: Implement a feature action that, once activated, opens a browser window and displays the website.
View Source Code